
Chapter 9 of 13 · PM Designer guide
Data logging in PM Designer: data loggers, historic tables and trend graphs
Data logging in PM Designer is done by data loggers: each one samples a block of up to 1,023 words on a timer, on a trigger bit or at clock moments, keeps up to about four million samples in the panel, and can write them to CSV, TXT or LDF files automatically. Historic data tables, historic trend graphs, radar charts and scatter charts then display either the live logging buffer or a file loaded back into a file buffer. An application can have 16 data loggers.
Applies to PM Designer V2.1 and V4.0Updated 11 Nov 2026Manual reference: Chapter 13, FB_REC application notes
Creating a data logger
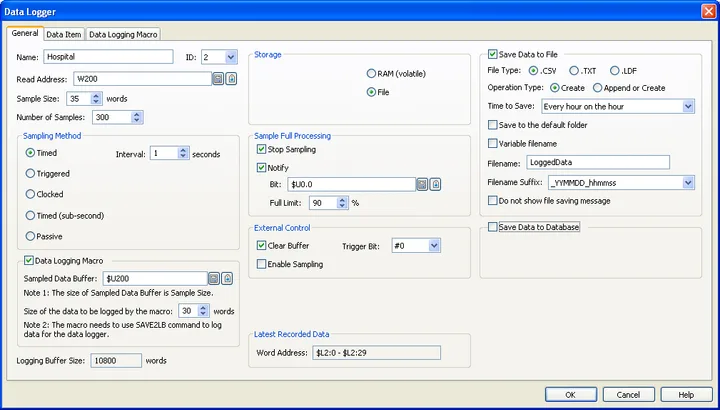
Right-click Data Loggers in the Project Manager and choose Add Data Logger, or use Panel > Data Logger > Add (Section 13.1). The General page (Section 13.1.2) defines what is sampled and when:
- Read Address and Sample Size: the first word of the data block to log and how many words, up to 1,023. One sample is one copy of that block with a time stamp.
- Number of Samples: the depth of the logging buffer. The memory comes from the panel's non-volatile pool shared with recipes and alarms; the compiler tells you when it does not fit.
- Sampling Method: Timed every 1 to 65,535 seconds; Triggered once per rising edge of a trigger bit, so the PLC decides when a sample is worth taking; Clocked at fixed moments of each hour (every minute, every 5, 10, 15, 30 or 60 minutes); or Passive, for a logger that only receives data loaded from a file or written by a macro.
- Notification bits that go on when the buffer is full or a sample is taken, and a Data Logging Macro that runs after every sample to process or convert the data and store it with
SAVE2LB. - Save logged data to file automatically at an interval, in CSV, TXT or LDF format, into the default folder or a path you give, with a file name that can include the date.
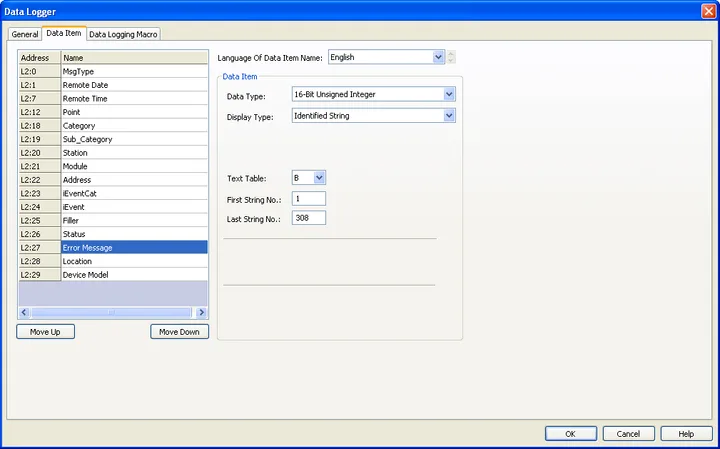
The Data Item page (Section 13.1.3) splits the sampled block into named items with a data type and display format, exactly as for a recipe block, and the address it shows for each item is where the latest sampled value can be read by any object. Names are per language and become the column headers in tables and files.
Logging to files
The logging buffer is bounded; files are not (Section 13.1.4). Three ways write a logger's data out: a function button with Save Logged Data To File or Save Logged Data (.ldf file); a command-block general command (operation codes 1, 14 and 10 for TXT, CSV and LDF); or the automatic periodic save on the General page. CSV is for people and Excel. LDF is the panel's own binary format and is the one you can load back into a logger or a file buffer to display again, provided the data item definitions match and the file has no more samples than the receiving logger holds. A common pattern is logger #2 sampling the process and saving temp_logged_YYMMDD.ldf every hour, and a passive logger #1 into which the operator loads any day's file to review it on a historic trend.
Name the folder with General Setup's default-folder rules (a new folder every day or month) so that a panel never exceeds the 4,096 files per folder limit, and point the folder at a USB stick or SD card on panels that have one.
Displaying logged data
Every historic object has a Data Source: the data logger's live buffer, or a file buffer (ID 0 to 15) filled by a function button with the Load Logged Data From File operation. Up to 16 file buffers exist per panel.
Historic data table
A grid with one row per sample and one column per data item plus date and time (Section 13.2). Scroll it with scroll button groups or a scroll bar, pick which items to show on its Data Item page, and filter rows on the Query page by a time range or by a Query Processing Macro that returns QRET(1) for rows to keep. Selecting a row can write that sample's values to a block of words, which is handy for a "load these settings" button.
Historic trend graph
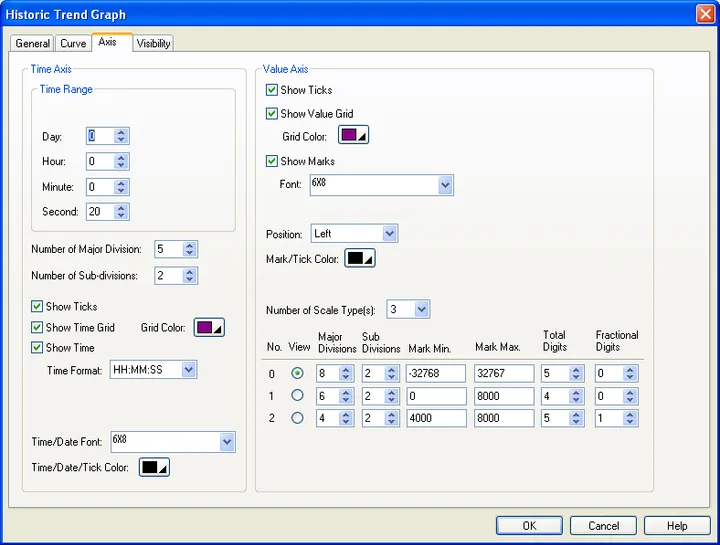
Curves of up to several data items against time (Section 13.3). The Curve page assigns each curve a data item, range, style and colour; the Axis page sets the time range (hours, minutes, seconds, or a dynamic range the PLC can change), major and minor divisions, grids, and the time and date formats; a cursor lets the operator pick a moment and read the values, and the Query page limits what is drawn. The trend is drawn from stored samples, so it survives screen changes and power cycles, unlike a line chart that only shows what it has read since it was opened (see Chapter 6).
Historic event table, radar and scatter charts
A historic event table (Section 13.4) lists predefined events with messages, a historic radar chart (Section 13.7) draws up to 8 curves on a polar time slice with a cursor, and a historic scatter chart (Section 13.6) plots one data item against another over a time range with point selection and dynamic ranges. All read from the same loggers and file buffers.
File buffers and macros (V4)
V4 adds macro commands that treat a file buffer as a record set, documented in the FB_REC application notes:
$U11 = 0
$U10 = LB_2_FB(1, 3, $U11)       // copy logger #1's buffer to file buffer #3 (no filter)
$U12 = FB_REC_CNT(3)             // how many records are in file buffer #3
$U100 = FB_REC(3, 0)             // oldest record into the word array at $U100
$U12 = $U12 - 1
$U200 = FB_REC(3, $U12)          // newest record into $U200...
$U300 = FB_REC_DATE(3, 0)        // date of the oldest record
$U310 = FB_REC_TIME(3, 0)        // time of the oldest record
SAVE2LB stores a converted block in a logger from a data logging macro and SAVE2LB_T (V4) does the same with a time stamp you supply, which lets a panel log data that arrived with its own timestamp, for example from a batch controller. CLR_LB empties a logger and REF_H_OBJ redraws the historic objects after a macro has changed the data.
Getting the data to a PC
- USB stick or SD card: the periodic save or a function button writes CSV files you can carry away.
- FTP: the panel is an FTP server (Panel Setup > FTP/VNC); a PC can fetch the log folder over the network with a browser or a script, and a macro can push files to an FTP server.
- Data Transfer Helper: Get logged data from a chosen logger for a time range into CSV or TXT without touching the project (Section 19.2).
- MQTT on V4 for live values rather than files (Chapter 12).
Design notes
- Log what you will look at. A 10-word block every 10 seconds for a month is 2.6 million samples; a clocked logger every 5 minutes with a daily CSV covers most reporting needs in a fraction of the memory.
- Use a triggered logger for batch records: the PLC raises the bit at the end of each cycle and the sample is the cycle's result.
- Keep the data item definitions stable once files exist; a changed layout stops LDF files loading.
- Tick Keep Previous Data > Sampled Data when downloading a revision that does not change the loggers, and save to file anyway.
Frequently asked questions
How much data can a Cermate panel log?
Up to 16 data loggers, each sampling up to 1,023 words, with a buffer of up to 4,194,304 samples in theory; in practice the non-volatile memory shared with recipes and alarms sets the limit and the compiler reports it. Saving to CSV or LDF files removes the limit.
What is an LDF file?
The panel binary format for logged data. Unlike CSV it can be loaded back into a passive data logger or a file buffer and shown on a historic trend graph or table, as long as the data item definitions match.
Can I show last week trend on the panel?
Yes. Save the logger to LDF files, add a function button with Load Logged Data From File into a file buffer, and set the historic trend graph data source to that file buffer.
How do I get the log files to a PC?
Copy them from the USB stick or SD card, fetch them over FTP from the panel, or use Data Transfer Helper to pull a time range straight from the logger into a CSV.
What is the difference between a line chart and a historic trend graph?
A line chart plots values it reads while the screen is open and loses them when the screen closes. A historic trend graph draws from a data logger or file buffer, so the history is kept and can be scrolled, queried and reloaded.
Stuck on a Cermate panel?
TSL Automation has supplied and supported Cermate HMIs since 2015. Send us the model, the PM Designer version and a screenshot of the error.
Written by TSL Automation Solutions from the PM Designer user manual and application notes that ship with the software, and from our own support work. Screenshots are from the manual and remain the property of Cermate Technologies Inc. PM Designer and PanelMaster are trademarks of Cermate Technologies Inc. Check your panel's own manual for model-specific limits.