
Chapter 6 of 13 · PM Designer guide
Graphs and charts in PM Designer: bar graphs, meters, line and scatter charts
PM Designer draws live process values with six graph objects: bar graphs and circular bar graphs for a single value against a scale, meters for a needle on an arc, line charts for up to eight series read from a block of words, scatter charts for X-Y pairs, and rotation indicators for a rotating device. All of them monitor an address (or a block for charts), take their data type and range from the property sheet, and can be shown or hidden by a bit or user level. Historic trends, which draw from logged data, are in Chapter 9.
Applies to PM Designer V2.1 and V4.0Updated 11 Nov 2026Manual reference: Chapter 8, application note on bar chart data structures
Bar graphs
A bar graph (Section 8.1) shows one monitored value as a bar that grows upward, downward, leftward or rightward. A polar bar grows from one end; a bipolar bar grows both ways from a middle point, which is the right choice for a deviation from set-point. On the General page set the Direction, the Data Type (16- and 32-bit integers, BCD, floating point), the Monitor Address, and either fixed Minimum and Maximum values or a Dynamic Range read from a block of words at runtime so the PLC can rescale the bar. The Scale page adds major ticks, sub-divisions, marks with a chosen number of digits, and a position (top, bottom, left, right, inner or outer).
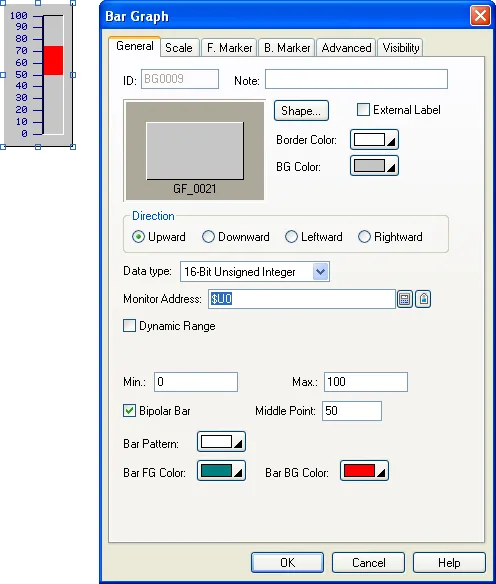
Two options make a bar graph more than a level indicator. The Advanced page's Range Display paints the bar in different colours when the value is below a low limit or above a high limit, with the limits fixed or read from variables, and can show the value as a percentage of full scale. The Forward and Backward Marker pages add up to 12 marks (triangles, diamonds or cones) whose count and positions come from a marker control block in the PLC: word 0 holds how many marks to show, words 1 to 12 their values (two words each for 32-bit data). Marks are coloured by comparing the monitored value with the mark value, so a batch target and an alarm limit can both ride along the bar.
Circular bar graphs
A circular bar graph (Section 8.3) is a bar bent around an arc: choose a span of 360, 270, 180 or 90 degrees and an origin angle, and the bar fills clockwise as the value rises. It shares the Advanced page (range colours and percentage display) and the Scale page with the straight bar graph, and the same fixed or dynamic range. Use it where a round gauge look is wanted but a needle would be hard to read at a glance, for example a tank fill or a progress ring.
Meters
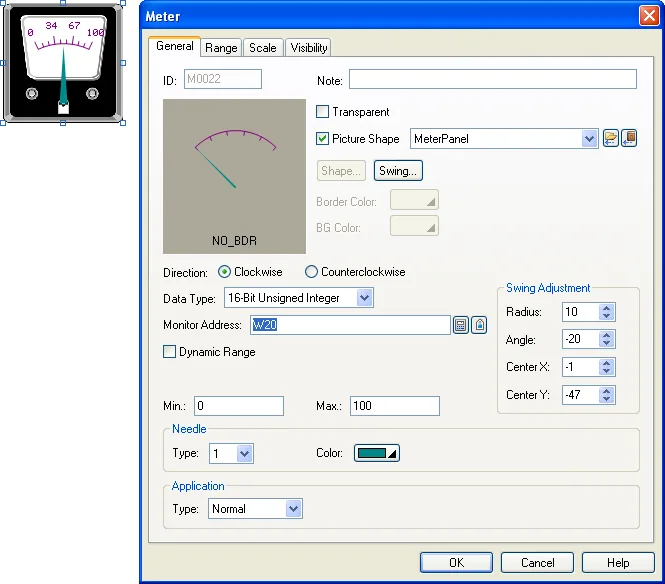
A meter (Section 8.2) rotates a needle over an arc scale. The same span and origin combinations as the circular bar are available, and both needle and scale are anti-aliased. The General page sets data type, monitor address and range; the Range page adds low and high range marks along the swing path, coloured and optionally driven by variables; the Scale page sets ticks and marks. Tick Picture Shape on the General page to draw the needle over a bitmap of your own dial, which is how custom gauges are made. The manual even documents a tower-crane anti-collision display built from three meters (Section 8.2.6).
Line charts
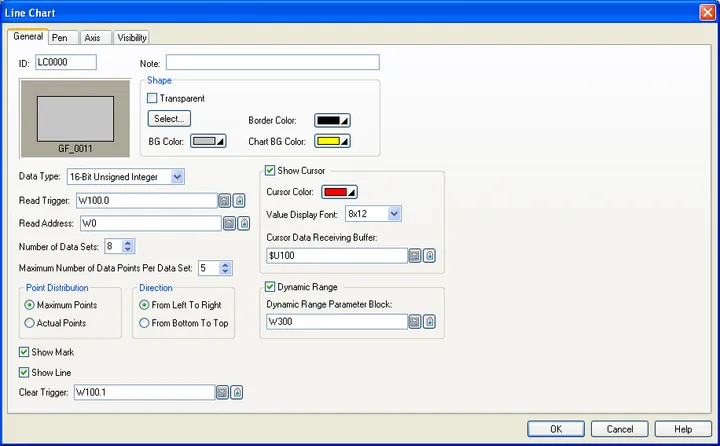
A line chart (Section 8.4) plots a set of values that the panel reads from a block of words when a Read Trigger bit goes on, and can show up to 8 sets (pens) at once. The horizontal position of a point is its index in the block, so a line chart is the object for a profile, a batch curve, a spectrum or anything the PLC has already stored as an array; it is not a scrolling trend of the last few minutes, which is what a historic trend graph on a data logger does (Chapter 9).
On the General page set the Data Type, the Read Trigger, the Clear Trigger (a bit that wipes the chart), the Number of Data Sets and the Number of Data Points per set, and the starting address of the data block. The block layout is simple: the first word(s) can carry the actual number of points, followed by the values of set 1, then set 2, and so on. The Pen page gives each set a range (or dynamic range), line style, colour, mark size and whether to show values; the Axis page configures ticks, grids, major and minor divisions and the marks on each axis, with fixed or dynamic minimum and maximum. A cursor option lets the operator slide a vertical line across the chart and writes the values under it to a Cursor Data Receiving Buffer, so a numeric display next to the chart can show the exact reading.
Keep reads small. A line chart with 8 sets of 500 points reads 4,000 words on every trigger. Trigger it only when the PLC has new data, not from a one-second timer, or the link slows for every other object on the screen.
Scatter charts
A scatter chart (Section 8.5) works like a line chart but every point has an X value and a Y value read from the block, up to 8 sets, with per-pen X and Y ranges and a cross-shaped cursor that snaps to the nearest point. It is the natural display for a pressure-volume curve, a torque-angle signature or a calibration table. The Axis page is shared with the line chart.
Rotation indicators
A rotation indicator (Section 8.6) is a ring of 4 to 40 lamps. Through a control word the PLC can turn all lamps off, light the lamp closest to a given angle, chase the lamps to animate rotation, light only the zero-degree lamp for "ready", light all for "initialising" or blink all for a fault. It is found under Object > Graph/Chart and takes a handful of words of configuration: lamp count, zero position, ring width and the on, off and blink colours.
Word layouts the PLC must fill
Every dynamic feature of these objects reads a small block of words. The V4 application note "The Data Structures for the Bar Charts" documents them precisely; the shapes are the same across objects:
| Block | 16-bit layout | Notes |
|---|---|---|
| Bar values (bar charts) | Word 0 = number of groups n; then the m bars of group 1, the m bars of group 2 ... n x m values | 32-bit data uses double-words in the same order. |
| Dynamic range | Word 0 = min, word 1 = max, words 2 to 3 = axis minimum (32-bit), words 4 to 5 = axis maximum (32-bit) | For 32-bit data: min, max, axis min, axis max as four double-words. |
| Reference lines, static range | Word 0 = position of line 1, word 1 = line 2 ... up to line m | An X value for vertical lines, a Y value for horizontal ones. |
| Reference lines, dynamic range | Word 0 = min, word 1 = max, then the line positions from word 2 | |
| Marker control block (bar graph) | Word 0 = number of marks shown, words 1 to 12 = mark values | Two words per entry for 32-bit data. |
Write these blocks in the PLC with the same data type the object uses, and remember that a 32-bit value takes two consecutive words. Mismatched types are the usual reason a chart draws nonsense while a numeric display of the same address looks right.
Choosing the right object
- One value, now: bar graph, circular bar or meter. Add range colours so the operator sees "high" without reading the scale.
- A curve the PLC already holds (profile, recipe curve, FFT): line chart on a read trigger.
- X against Y: scatter chart.
- Values over the last minutes, hours or days: a data logger plus a historic trend graph, not a line chart.
- Position or rotation of a device: rotation indicator, or a meter with a picture shape.
Frequently asked questions
How do I show a trend of the last hour on a Cermate panel?
Not with a line chart. Create a data logger that samples the value on a timer and place a historic trend graph bound to that logger; it keeps the history across screen changes and power cycles. See the data logging chapter.
What is the difference between a line chart and a scatter chart?
A line chart plots values in the order they sit in a block of words, so X is the index. A scatter chart reads X and Y pairs, so points can be anywhere. Both support up to 8 data sets and a cursor.
Can the PLC change the scale of a bar graph at runtime?
Yes. Tick Dynamic Range on the General page and point it at a block of words holding minimum, maximum and the axis limits; the object rescales whenever the PLC writes them.
Why does my bar graph show the wrong value?
Almost always a data type mismatch. The object must use the same type as the PLC register (16- or 32-bit, signed, BCD or float). A 32-bit float read as a 16-bit integer gives a meaningless bar.
Stuck on a Cermate panel?
TSL Automation has supplied and supported Cermate HMIs since 2015. Send us the model, the PM Designer version and a screenshot of the error.
Written by TSL Automation Solutions from the PM Designer user manual and application notes that ship with the software, and from our own support work. Screenshots are from the manual and remain the property of Cermate Technologies Inc. PM Designer and PanelMaster are trademarks of Cermate Technologies Inc. Check your panel's own manual for model-specific limits.