
Section 13.1.3 · Chapter 13: Data Collection and Historic Displays
Data Logger - Data Item Settings
Use the Data Item page to define the data items of the sampled data for a data logger. The following is an example of the Data Item page.
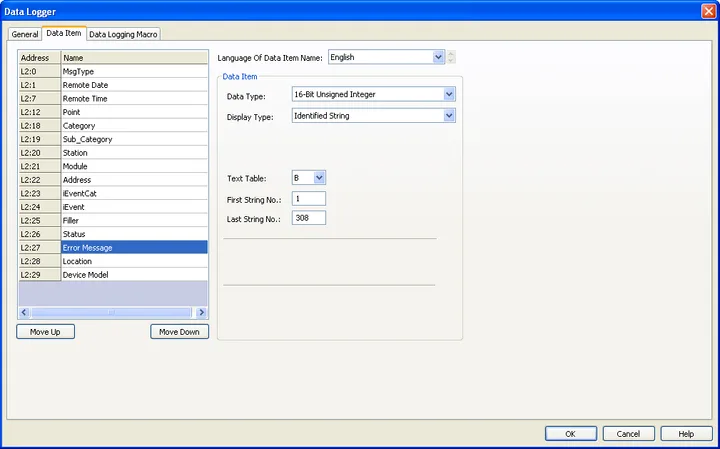
The Data Item page contains two parts. The left part is the data item list that shows the address and name of each data item in rows. The right part shows the properties of the selected data item. To select a data item, click the row of that data item in the data item list.
The following table describes each property of the data item.
|
Property |
Description | |||||||
|---|---|---|---|---|---|---|---|---|
| Address | You can use the address shown here to refer to the latest sampled value of the data item. | |||||||
| Name | Specifies the name of the data item for the language specified in the Language Of Data Item Name field. | |||||||
| Language of Data Item | Select a language so you can view and edit the name of the data item on the left part for that language. | |||||||
| Data Item | Data Type | The data type of the data item. The supported data types include: 16-Bit Unsigned Integer, 32-Bit Unsigned Integer, 16-Bit Signed Integer, 32-Bit Signed Integer, 16-Bit BCD, 32-Bit BCD, 32-Bit Floating Point, Byte Array (Character String) and Word Array (Double -Byte Character String). | ||||||
| Display Type | The display type for the value of the data item. The following table shows the available display types for each data type. | |||||||
| Data Type | Available Display Types | |||||||
| 16-Bit Unsigned Integer | 16-Bit Unsigned Decimal, 16-Bit Hexadecimal, 16-Bit Octal, Indexed String, Identified String | |||||||
| 32-Bit Unsigned Integer | 32-Bit Unsigned Decimal, 32-Bit Hexadecimal, 32-Bit Octal, Indexed String, Identified String | |||||||
| 16-Bit Signed Integer | 16-Bit Signed Decimal, Indexed String, Identified String | |||||||
| 32-Bit Signed Integer | 32-Bit Signed Decimal, Indexed String, Identified String | |||||||
| 16-Bit BCD | 16-Bit Unsigned Decimal | |||||||
| 32-Bit BCD | 32-Bit Unsigned Decimal | |||||||
| 32-Bit Floating Point | 32-Bit Floating Point, Exponential Format | |||||||
| Byte Array (Character String) | ASCII String, Western European String, Cyrillic String | |||||||
| Word Array (Double- Byte Character String) | Chinese(PRC) String, Chinese(Taiwan) String, Unicode String, | |||||||
| Note: For details about the Indexed String and Identified String, please see Section 13.1.6. Difference between Indexed String and Identified String. | ||||||||
| Total Digits / Length | Specifies the number of digits to be displayed for the value of the data item. | |||||||
| Fractional Digits |
Specifies how to display the fractional part of the
value of the data item. When the Display Type is 32-bit
Floating Point, this property specifies the number of
fractional digits to be displayed. When the Display Type
is not 32-bit Floating Point, this property specifies
not only the number of fractional digits to be
displayed, but also the number of least significant
digits to be displayed as the fractional part. With this
feature, an integer can be shown as a fixed point
number. Example: |
|||||||
| Display Type | Total Digits | Fractional Digits | Sampled Value | Displayed Value | ||||
| 32-bit Floating Point | 4 | 2 | 12.34 | 12.34 | ||||
| 32-bit Floating Point | 4 | 2 | 123.4 | 23.40 | ||||
| 16-bit Signed Decimal | 5 | 2 | 123.45 | 123.45 | ||||
| 16-bit Signed Decimal | 5 | 2 | -5 | -0.05 | ||||
| Text Table | Available when the display type is Indexed String and Identified String. Select a text table where the string is located. | |||||||
| First String No. | Available when the display type is Indexed String and Identified String. Specifies the first string number of the text table. | |||||||
| Last String No. | Available when the display type is Indexed String and Identified String. Specifies the last string number of the text table. | |||||||
| Scaling | Scaling |
Check this option if you want the value of the data item
to be displayed in a scaled manner. The following is the
scaling formula: DisplayedValue = SampledValue * Gain + Offset Note: The Gain and Offset are 32-bit floating point numbers. They have at most 6 significant digits. Rounding and truncation errors may occur. |
||||||
| Gain | Available when the Scaling option is checked. Specifies the Gain used in the scaling formula. | |||||||
| Offset | Available when the Scaling option is checked. Specifies the Offset used in the scaling formula. | |||||||
| Database | Show Column Names | Available when the target panel is HMI runtime. Check this option to show the column name of the table in the database in the top-left part. | ||||||
| Column Names | Select a language so you can use the Data Item Name of that language as the column name. | |||||||
Need PM Designer itself?
V4 for current PK, PT, ITV and PM panels, V2 for older models. Free, sent by email.
Source.Section 13.1.3 of the PM Designer Software User Manual, Edition 2.0, © Cermate Technologies Inc. (www.cermate.com, service@cermate.com). Reproduced online, with the manual's own figures, by TSL Automation Solutions, authorised Cermate distributor, for users of Cermate HMI panels. PM Designer and PanelMaster are trademarks of Cermate Technologies Inc.
Text and figures are the manufacturer's and may describe features your panel or software version does not have. For a plain-language introduction read the PM Designer guide; for help with a specific panel contact TSL Automation.