
Section 13.5.4 · Chapter 13: Data Collection and Historic Displays
Historic Scatter Chart - General Settings
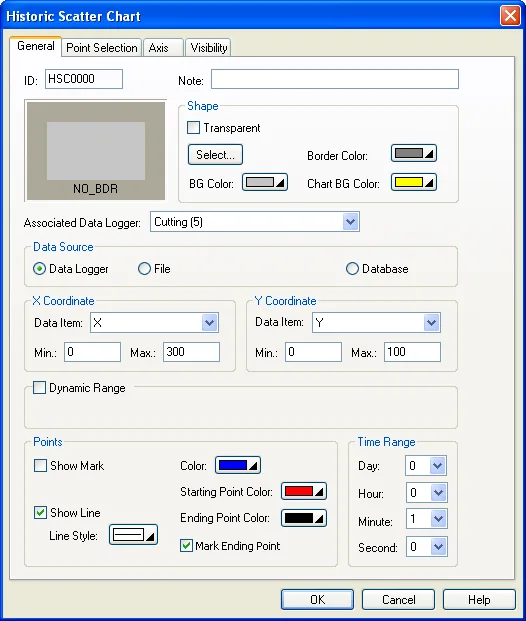
The following table describes each property in the General page.
| Property | Description | ||
|---|---|---|---|
| ID | The object’s identifier. It is generated when the object is created and is unchangeable. The identifier is unique within the screen where the object is located. The format of the IDs for the Historic Scatter Charts is HSCnnnn. | ||
| Note | You can type a note for the object. | ||
| Shape settings |
For details about the following properties, see
Section 4.3.4 Setting up the Shape
of an Object.
 ,
Border Color, BG Color |
||
| Chart BG Color | Select a color for the background of the chart. | ||
| Associated Data Logger | Specifies the associated data logger. | ||
| Data Source | Select a data logger or file as the source of the collected data. | ||
| File Buffer ID | Specify the File Buffer ID if the data source is a file. To specify a file buffer ID for a file, you can use the Load Logged Data From File operation of the function button. Please see Section 5.4 Performing Built-in Function Using Function Buttons for details. | ||
| X Coordinate | Data Item | Select the data item of the associated data logger for the X Coordinate. | |
| Min | Specifies the minimum value of the data item for X Coordinate when Dynamic Range is not selected. | ||
| Max | Specifies the maximum value of the data item for X Coordinate when Dynamic Range is not selected. | ||
| Y Coordinate | Data Item | Select the data item of the associated data logger for the Y Coordinate. | |
| Min | Specifies the minimum value of the data item for Y Coordinate when Dynamic Range is not selected. | ||
| Max | Specifies the maximum value of the data item for Y Coordinate when Dynamic Range is not selected. | ||
| Dynamic Range | <Check Box> |
When this option is selected, the following four ranges
can be specified at runtime: * The maximum time duration for the data collection * The minimum and the maximum for the X values and Y values * The minimum and maximum of the marks for the X axis and Y axis * The number of major and sub division for X axis and Y axis The data that specifies the above four ranges should be set and arranged correctly in a memory block called the dynamic range parameter block. You need to specify the dynamic range parameter block in the Dynamic Range Parameter Block field. |
|
| Dynamic Range Parameter Block |
Specifies the variable that stores the dynamic range
parameter block for the historic scatter chart when
Dynamic Range is selected. Click
 to enter an address for this field. Click  to select a tag for this field. The following table shows the content of the parameter block. |
||
| Word | Parameter | ||
| 0,1 | The maximum time range in second | ||
| 2,3 | The minimum of X values | ||
| 4,5 | The maximum of X values | ||
| 6,7 | The minimum of Y values | ||
| 8,9 | The maximum of Y values | ||
| 10,11 | The number of major division for the X axis;32-bit integer number. The minimum value is 1. | ||
| 12,13 | The number of sub-division for the X axis;32-bit integer number. The minimum value is 1. | ||
| 14,15 | The minimum of the mark for the X axis; 32-bit integer number | ||
| 16,17 | The maximum of the mark for the X axis; 32-bit integer number | ||
| 18,19 | The number of major division for the Y axis;32-bit integer number. The minimum value is 1. | ||
| 20,21 | The number of sub-division for the Y axis;32-bit integer number. The minimum value is 1. | ||
| 22,23 | The minimum of the mark for the Y axis; 32-bit integer number | ||
| 24,25 | The maximum of the mark for the Y axis; 32-bit integer number | ||
| Points | Show Mark | Check this option so the historic scatter chart will display all the data point markers. | |
| Mark Size | Select a size for the data point mark. The selection is valid when the Show Mark option is selected. | ||
| Show Lines | Check this option so the historic scatter chart will display the connected lines. | ||
| Line Style | Select a style for the connecting lines. The selection is valid when the Show Line option is selected. | ||
| Color | Select a color for the connecting lines. | ||
| Starting Point Color | Select a color for the starting point. | ||
| Ending Point Color | Select a color for the ending point. | ||
| Mark Ending Point |
Check the option to mark the ending point of the curve
with a small cross to make the ending point noticeable.
It is only available when the Show Mark option is
unchecked. In the following picture, the yellow cross
marks the ending point.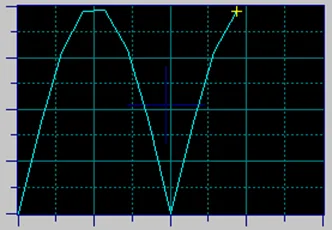 |
||
| Time Range | Day | Select an integer value from 1 through 31 representing the day of the month. | |
| Hour | Select an integer value from 0 through 23 representing the hour of the day. | ||
| Minute | Select an integer value from 0 through 59 representing the minute. | ||
| Second | Select an integer value from 0 through 59 representing the second. | ||
Need PM Designer itself?
V4 for current PK, PT, ITV and PM panels, V2 for older models. Free, sent by email.
Source.Section 13.5.4 of the PM Designer Software User Manual, Edition 2.0, © Cermate Technologies Inc. (www.cermate.com, service@cermate.com). Reproduced online, with the manual's own figures, by TSL Automation Solutions, authorised Cermate distributor, for users of Cermate HMI panels. PM Designer and PanelMaster are trademarks of Cermate Technologies Inc.
Text and figures are the manufacturer's and may describe features your panel or software version does not have. For a plain-language introduction read the PM Designer guide; for help with a specific panel contact TSL Automation.