TSL Automation Solutions Logo
Chapter 13: Data Collection and Historic Displays: 47 topics
  1. 13.1Data Logger
  2. 13.1.1Data Logger - Settings
  3. 13.1.2Data Logger - General Settings
  4. 13.1.3Data Logger - Data Item Settings
  5. 13.1.4Using File to Save Logged Data
  6. Displaying Logged Data Values Using Historic Data Tables
  7. 13.2.1Historic Data Table - Basic Operations
  8. 13.2.2Historic Data Table - Operation Options
  9. 13.2.3Historic Data Table - Settings
  10. 13.2.4Historic Data Table - General Settings
  11. 13.2.5Historic Data Table - Data Item Settings
  12. 13.2.6Historic Data Table - Query Settings
  13. Displaying Logged Data Trend Using Historic Trend Graph
  14. 13.3.1Historic Trend Graph - Basic Operations
  15. 13.3.2Historic Trend Graph - Operation Options
  16. 13.3.3Historic Trend Graph - Settings
  17. 13.3.4Historic Trend Graph - General Settings
  18. 13.3.5Historic Trend Graph - Curve Settings
  19. 13.3.6Historic Trend Graph - Axis Settings
  20. 13.2.6Historic Trend Graph - Query Settings
  21. Displaying History of Predefined Events Using Historic Event Tables
  22. 13.4.1Historic Event Table - Basic Operations
  23. 13.4.2Historic Event Table - Operation Options
  24. 13.4.3Historic Event Table - Settings
  25. 13.4.4Historic Event Table - General Settings
  26. 13.4.5Historic Event Table - Message Settings
  27. Displaying Time Slice Data Profile Using Single Record Line Charts
  28. 13.5.1Single Record Line Chart - Basic Operations
  29. 13.5.2Single Record Line Chart - Operation Options
  30. 13.5.3Single Record Line Chart - Settings
  31. 13.5.4Single Record Line Chart - General Settings
  32. 13.5.5Single Record Line Chart - Pen Settings
  33. 13.5.6Single Record Line Chart - Axis Settings
  34. Historic Scatter Chart
  35. 13.6.1Historic Scatter Chart - Basic Operations
  36. 13.6.2Historic Scatter Chart - Operation Options
  37. 13.5.3Historic Scatter Chart - Settings
  38. 13.5.4Historic Scatter Chart - General Settings
  39. 13.6.5Historic Scatter Chart - Pen Settings
  40. 13.5.6Historic Scatter Chart - Axis Settings
  41. Historic Radar Chart
  42. 13.7.1Historic Radar Chart - Basic Operations
  43. 13.6.2Historic Radar Chart - Operation Options
  44. 13.7.3Historic Radar Chart - Settings
  45. 13.7.4Historic Radar Chart - General Settings
  46. 13.7.5Historic Radar Chart - Curve Settings
  47. 13.7.6Historic Radar Chart - Scale Settings
All 20 chapters →

Section 13.1.4 · Chapter 13: Data Collection and Historic Displays

Using File to Save Logged Data

The software allows you to save logged data in CSV/TXT/LDF files and view the data later. Hence, the size of the battery backed RAM or the buffer sizes of the data loggers will not limit the size of the historical data you want to collect.

There are three ways to write the logged data of a data logger to a CSV/TXT/LDF file:

  1. You can use a function button to perform “Save Logged Data (.ldf file)” or "Save Logged Data To File". The button writes all the logged data of the specified data logged to a file.

  2. You can use the Command Block to request this operation.

  3. You can configure a data logger to write its collected data to a file automatically with preset time intervals.

To view the logged data of a file, you need to load the data of that file into a data logger first. A data logger is able to receive the data from a file only when:

  1. The definitions of the data items of the file and the data logger are identical, and

  2. The number of samples of the file is not greater than the number of samples of the data logger.

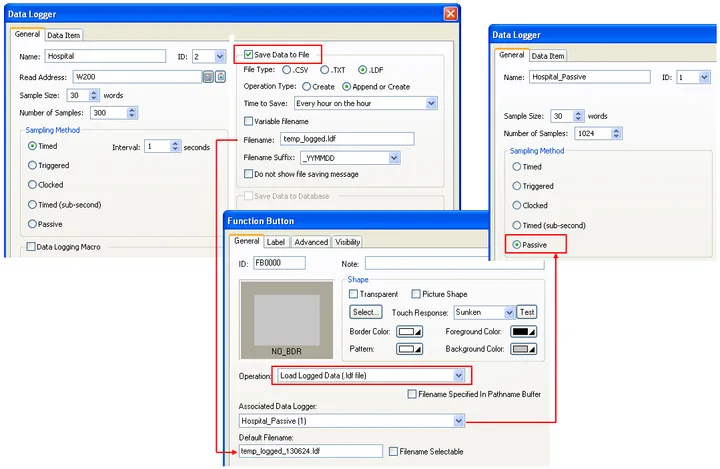
The following is an example of data logging and loading:

The data logger #2 saves the logged data to temp_logged_YYMMDD.ldf in every hour.

The data logger #1 with Passive sampling method is able to receive the data from the file.

You can use the function button to load the logged data from temp_logged_130624.ldf and save it to the passive data logger #1.
Need PM Designer itself?

V4 for current PK, PT, ITV and PM panels, V2 for older models. Free, sent by email.

Source.Section 13.1.4 of the PM Designer Software User Manual, Edition 2.0, © Cermate Technologies Inc. (www.cermate.com, service@cermate.com). Reproduced online, with the manual's own figures, by TSL Automation Solutions, authorised Cermate distributor, for users of Cermate HMI panels. PM Designer and PanelMaster are trademarks of Cermate Technologies Inc.

Text and figures are the manufacturer's and may describe features your panel or software version does not have. For a plain-language introduction read the PM Designer guide; for help with a specific panel contact TSL Automation.