
Section 13.2.6 · Chapter 13: Data Collection and Historic Displays
Historic Data Table - Query Settings
This section describes how to query logged data. The following is an example of the Query page of the Historic Data Table dialog box.
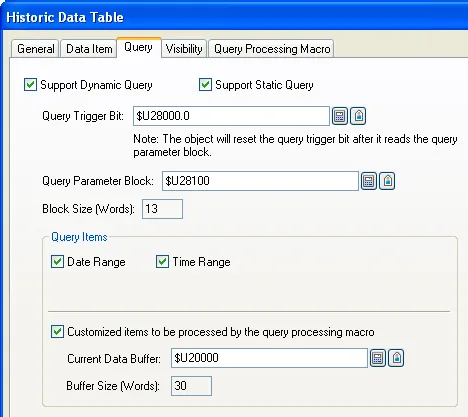
The following table describes each property in the Query page of the Historic Data Table dialog box.
|
Property |
Description | |||
|---|---|---|---|---|
| Support Dynamic Query | Check this option if you want the object displays the records filtered by dynamic conditions set at runtime. With dynamic query, the object performs the query operation only when the trigger bit changes from Off to On at runtime. | |||
| Support Static Query | Check this option if you want the object displays the records filtered by predefined conditions. With static query, any change of query conditions at runtime will not be applied. | |||
| Query Trigger Bit |
Specifies the bit that will trigger the query operation
at runtime. The HMI reads the Query Parameter Block and
refreshes the object according to the current query
conditions whenever the Query Trigger Bit changes from Off to On. Click to enter the bit address. Click  to enter the bit tag. Available only when the Support
Dynamic Query option is selected. |
|||
| Query Parameter Block |
Specifies the location that stores the query parameters. Click
to enter an address for this field. Click
to select a tag for this field.The following table shows the data arrangement of the parameter block. |
|||
| Word | Description | |||
| 0 |
The query flags. |
|||
| Bit | Operation | |||
| 0 | Reserved for future use. Must be 0. | |||
| 1 | Query the data records that occurred within the specified duration when the bit is on. The date range is specified in word 1-6 of the Query Parameter Block. The time range is specified in word 7-12 of the Query Parameter Block. | |||
| 2~14 | Reserved for future use. Must be 0. | |||
| 15 | Customized items handled by the query processing macro | |||
|
Note: 1) When both query flags are on, the
result will fulfill both query conditions.
2) If you want to display all data when the query processing is enabled, set the first parameter to zero, i.e. set all the query flags to 0, and then trigger the query processing. |
||||
| 1,2,3 |
The start date of the date range. Year (word 1): 0~99; Month (word 2): 1~12; Day (word 3): 1~31 |
|||
| 4,5,6 |
The end date of the date range. Year (word 4): 0~99; Month (word 5): 1~12; Day (word 6): 1~31 |
|||
| 7,8,9 |
The start time of the time range. Hour (word 7): 0~23; Minute (word 8): 0~59; Second (word 9): 0~59 |
|||
| 10,11,12 |
The end time of the time range. Hour (word 10): 0~23; Minute (word 11): 0~59; Second (word 12): 0~59 |
|||
| Note: The word 1- 12 of the Query Parameter Block will be available only if the corresponding query item is selected. | ||||
| Block Size (Words) | The size in word of query parameter block. | |||
| Query Items | Date Range | Check this option if you want the object to display the records that occur in the specified date range. | ||
| Time Range | Check this option if you want the object to display the records that occur in the specified time range. Available only when the Date Range is checked. | |||
| Customized items to be processed by the query processing macro |
Check this option if you want to set query conditions in
query processing macro. Note: A query processing macro must use QRET command to report if the currently processed record is qualified for the current query and terminate itself. Only qualified records are displayed according to the query conditions. |
|||
| Current Data Buffer |
Specifies the variable representing the data buffer for
query processing macro to save the current record. Click
to enter an address for this field. Click
to select a tag for this field. |
|||
| Buffer Size | The size of the current data buffer which is the size of a record. | |||
Need PM Designer itself?
V4 for current PK, PT, ITV and PM panels, V2 for older models. Free, sent by email.
Source.Section 13.2.6 of the PM Designer Software User Manual, Edition 2.0, © Cermate Technologies Inc. (www.cermate.com, service@cermate.com). Reproduced online, with the manual's own figures, by TSL Automation Solutions, authorised Cermate distributor, for users of Cermate HMI panels. PM Designer and PanelMaster are trademarks of Cermate Technologies Inc.
Text and figures are the manufacturer's and may describe features your panel or software version does not have. For a plain-language introduction read the PM Designer guide; for help with a specific panel contact TSL Automation.