
Section 13.2.5 · Chapter 13: Data Collection and Historic Displays
Historic Data Table - Data Item Settings
This section describes how to define the display format for the sampled values of each data item. The following is an example of the Data Item page.
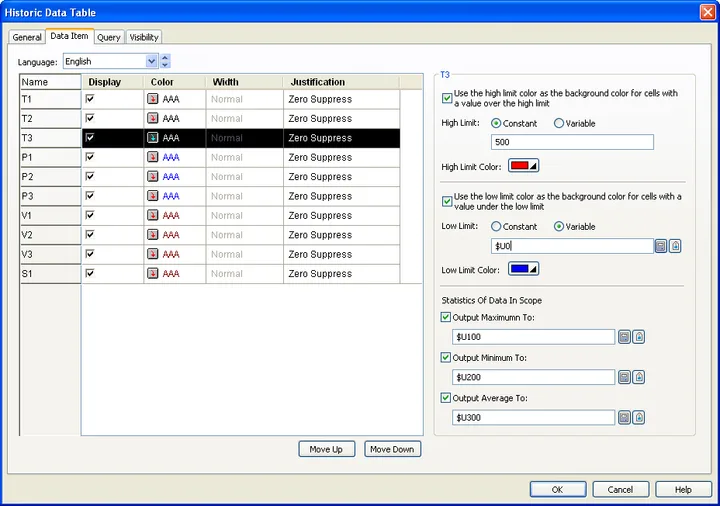
The following table describes each property in the Data Item page.
| Property | Description | ||
|---|---|---|---|
| Language | Select a language so you can view and edit the settings for that language. | ||
| Row #n of the property table | Name | The name of data item #n. The data item names are defined in the Data Item page of the Data Logger dialog box. | |
| Display | Check this option if you want the object to display data item #n. | ||
| Color | Select a color for displaying data item #n. | ||
| Width | The column width for displaying data item #n. There are five types of width when the data type is Byte Array or Word Array: Normal, Narrow, Extra Narrow, Width and Extra Width. | ||
| Justification | The justification for displaying data item #n. There are three types of justification: | ||
| Option | Description | ||
| Zero Suppress | The leading digits will not display when they are 0. | ||
| Leading Zeros | All digits will display. | ||
| Leading Spaces | The leading digits will display as blank characters when they are 0. | ||
You need to make a selection before editing the data item. To
select a data item, click the row of that data item in the list.
The following table describes each property of the selected data item.
| Property | Description |
|---|---|
| Use the high limit color as the background color for cells with a value over the high limit | Check this option if you want to use the high limit color as the background color for cells with a value over the specified high limit. |
| High Limit |
Specifies the high limit when the Constant is selected. When the Variable is selected, this property specifies the variable that stores the high limit at runtime. Click  to enter an address. Click  to select a tag. |
| High Limit Color | The background color for cells if the value over the specified high limit. |
| use the low limit color as the background color for cells with a value over the low limit | Check this option if you want to use the low limit color as the background color for cells with a value below the specified low limit. |
| Low Limit |
Specifies the low limit when the Constant is selected. When the Variable is selected, this property specifies the variable that stores the low limit at runtime. Click
to enter an address. Click
to select a tag. |
| Low Limit Color | The background color for cells if the value below the specified low limit. |
| Output Maximum To |
Check this option if you want to find the maximum of the
data currently viewable and store the result in the specified
variable at runtime.
Click
to enter an address. Click
to select a tag. |
| Output Minimum To |
Check this option if you want to find the minimum value
of the data currently viewable and store the result in the specified
variable at runtime.
Click
to enter an address. Click
to select a tag. |
| Output Average To |
Check this option if you want to calculate the average
of the data currently viewable and store the result in the specified
variable at runtime.
Click
to enter an address. Click
to select a tag. |
Need PM Designer itself?
V4 for current PK, PT, ITV and PM panels, V2 for older models. Free, sent by email.
Source.Section 13.2.5 of the PM Designer Software User Manual, Edition 2.0, © Cermate Technologies Inc. (www.cermate.com, service@cermate.com). Reproduced online, with the manual's own figures, by TSL Automation Solutions, authorised Cermate distributor, for users of Cermate HMI panels. PM Designer and PanelMaster are trademarks of Cermate Technologies Inc.
Text and figures are the manufacturer's and may describe features your panel or software version does not have. For a plain-language introduction read the PM Designer guide; for help with a specific panel contact TSL Automation.