
Section 13.3.6 · Chapter 13: Data Collection and Historic Displays
Historic Trend Graph - Axis Settings
This section describes how to define the Time axis (X axis) and the Y axis for the historic trend graph.
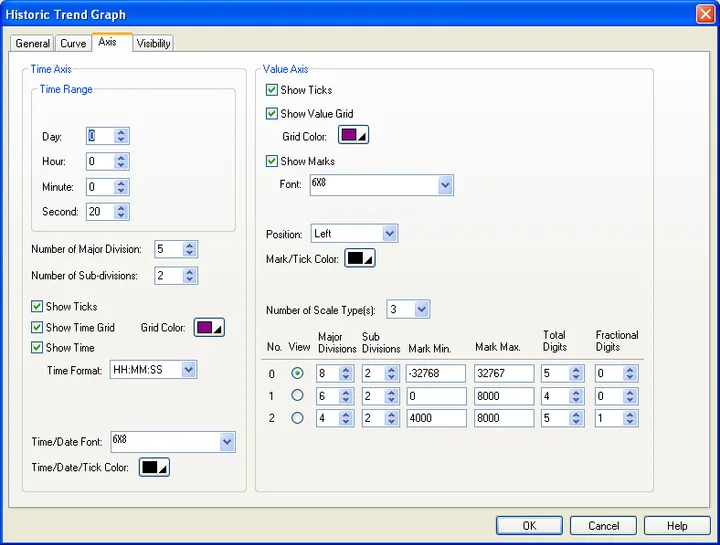
The following table describes each property in the Axis page.
| Property | Description | ||
|---|---|---|---|
| Time Axis – Time Range | Dynamic Range | Check this option if you want the maximum time duration to be controlled by the dynamic range parameter block of the associated object at runtime. This option is available only when the Dynamic Range option on the General page is checked. | |
| Unit | Select a unit for the dynamic range. The field is only available when Dynamic Range is checked. | ||
| Day/Hour/Minute/Second | If Dynamic Range is not checked on both the general page and the axis page, you need to specify the maximum time duration. | ||
| Time Axis | Number of Major Divisions | The number of major divisions for the X axis. The minimum you can specify is one. | |
| Number of Sub-divisions | The number of divisions between two adjacent major ticks. The minimum you can specify is one. | ||
| Show Ticks | Check this option if you want the X axis to have ticks. | ||
| Show Time Grid | Select this option if you want the X axis to have vertical grids. | ||
| Grid Color | Select a color for the vertical grids. | ||
| Show Time | Check this option if you want to display the time. You need to select a format for displaying the time. | ||
| Time Format | The format of how the time is displayed. There are two formats available. | ||
| Format | Description | ||
| HH:MM | HH: 00-23 (hour); MM: 00-59 (minute) | ||
| HH:MM:SS | HH: 00-23 (hour); MM: 00-59 (minute); SS: 00-59 (second) | ||
| Time/Date Font | Font of the time/date. | ||
| Time/Date/Tick Color | Select a color for the X axis and its ticks. | ||
| Value Axis | Show Ticks | Check this option if you want the Y axis to have ticks. | |
| Show Value Grid | Select this option if you want the Y axis to have horizontal grids. | ||
| Grid Color | Select a color for the horizontal grids. | ||
| Show Marks | Check this option if you want the major ticks to have marks. | ||
| Font | The font of the marks. | ||
| Dynamic Range | Check this option if you want the minimum and maximum of the marks to be controlled by the dynamic range parameter block of the associated object at runtime. | ||
| Position | Select a position to locate the scale. The scale can be displayed on the left, the right or both sides. | ||
| Mark/Tick Color | Select a color for the marks and ticks. | ||
| Value Axis - Scale Type | Number of Scale Type(s) | The number of scale types. You can define up to 5 sets of scale settings for the value axis of a historic trend graph. | |
| No. | The number of the scale type. | ||
| View | Select a type so you can view the historic trend graph with that scale settings. | ||
| Major Divisions | The number of major divisions for the value axis. The minimum you can specify is one. | ||
| Sub-divisions | The number of divisions between two adjacent major ticks. The minimum you can specify is one. | ||
| Mark Min. | The minimum of the marks. You can specify a 32-bit signed integer. Available only when the dynamic range is checked. | ||
| Mark Max. | The maximum of the marks. You can specify a 32-bit signed integer. Available only when the dynamic range is checked. | ||
| Total Digits | The total digits to be displayed for the marks. | ||
| Fractional Digits | The number of fractional digits for the marks. For example, when the Maximum is 5000, the Total Digits is 4, and the Fractional Digits is 2, the mark for the Maximum will be 50.00. | ||
Need PM Designer itself?
V4 for current PK, PT, ITV and PM panels, V2 for older models. Free, sent by email.
Source.Section 13.3.6 of the PM Designer Software User Manual, Edition 2.0, © Cermate Technologies Inc. (www.cermate.com, service@cermate.com). Reproduced online, with the manual's own figures, by TSL Automation Solutions, authorised Cermate distributor, for users of Cermate HMI panels. PM Designer and PanelMaster are trademarks of Cermate Technologies Inc.
Text and figures are the manufacturer's and may describe features your panel or software version does not have. For a plain-language introduction read the PM Designer guide; for help with a specific panel contact TSL Automation.