
Section 13.6.1 · Chapter 13: Data Collection and Historic Displays
Historic Scatter Chart - Basic Operations
Use the following steps to create a single record line chart:
-
Click the Historic Scatter Chart icon
 in the Object toolbar, or select
Historic Scatter Chart in the Object sub-menu.
-
Move the cursor to the screen on which you want to create the object.
-
Click at the desired position on the screen to place the new object.
A historic scatter chart displays a set of data collected by a data logger in the specified time range. It draws a data point for each datum and allows to connect all the data points in sequence by lines. Each datum is a coordinate that contains an X value and a Y value. The X value, a value of X coordinate, is the vertical position of a data point. The Y value, a value of Y coordinate, is the horizontal position of a data point. Both X value and Y value are determined by the value of the selected data item in the associated data logger.
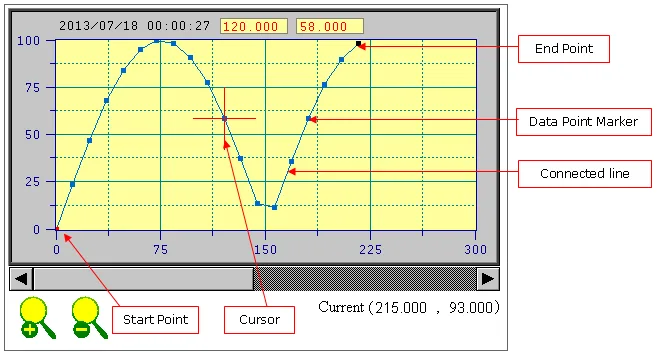
A historic scatter chart can provide a cursor for you to select desired data points. The cursor of the historic scatter chart is a cross. The user can move and snap the cursor vertically and horizontally within a historic scatter chart to the nearest data point. The value of the selected data point can be displayed and output to an internal or external variable called Output Selected Point Data.
Need PM Designer itself?
V4 for current PK, PT, ITV and PM panels, V2 for older models. Free, sent by email.
Source.Section 13.6.1 of the PM Designer Software User Manual, Edition 2.0, © Cermate Technologies Inc. (www.cermate.com, service@cermate.com). Reproduced online, with the manual's own figures, by TSL Automation Solutions, authorised Cermate distributor, for users of Cermate HMI panels. PM Designer and PanelMaster are trademarks of Cermate Technologies Inc.
Text and figures are the manufacturer's and may describe features your panel or software version does not have. For a plain-language introduction read the PM Designer guide; for help with a specific panel contact TSL Automation.