
Section 8.3.2 · Chapter 8: Graphs and Charts
Circular Bar Graph - Operation Options
The following operation options can be added to a circular bar graph to make it more informative. You need to select and set up these options in the Circular Bar Graph property sheet.
|
Options |
Description |
|---|---|
| Range Display | You can specify a low limit and a high limit for the object. The limits can be constants or variables. At runtime, when the monitored value is below the low limit, the object shows the bar with the FG color and the BG color set for the low limit. When the monitored value is above the high limit, the object shows the bar with the FG color and the BG color set for the high limit. |
| Percentage Display |
The object can show the current bar length as a
percentage of the full bar length.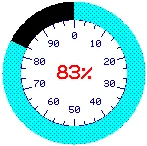 Select and set up this option in the Advanced page. |
| Scale | The circular bar graph can have a circular scale. Select and set up this option in the Scale page. |
| Visibility Control | The object can be shown or hidden either by a specified bit or by the current user level. Select and set up this option in the Visibility page. |
Need PM Designer itself?
V4 for current PK, PT, ITV and PM panels, V2 for older models. Free, sent by email.
Source.Section 8.3.2 of the PM Designer Software User Manual, Edition 2.0, © Cermate Technologies Inc. (www.cermate.com, service@cermate.com). Reproduced online, with the manual's own figures, by TSL Automation Solutions, authorised Cermate distributor, for users of Cermate HMI panels. PM Designer and PanelMaster are trademarks of Cermate Technologies Inc.
Text and figures are the manufacturer's and may describe features your panel or software version does not have. For a plain-language introduction read the PM Designer guide; for help with a specific panel contact TSL Automation.