
Section 8.5.5 · Chapter 8: Graphs and Charts
Scatter Chart - Pen Settings
This section describes how to define the pens for the scatter charts. The following is an example of the Pen page.
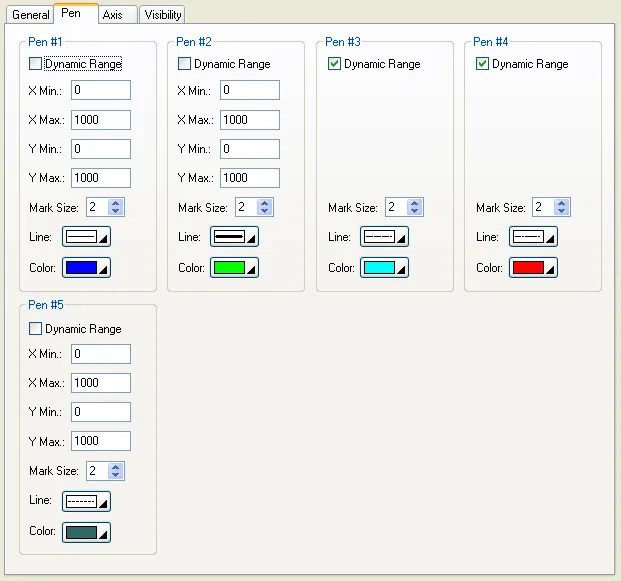
The following table describes each property in the Pen page. Note that pen #1 is for data set 1; pen #2 is for data set 2; and so on.
|
Property |
Description | |
|---|---|---|
| Pen #1 to Pen #8 | Dynamic Range | Check this option so the minimum and maximum for the X and Y values of the associated data set will be specified at runtime. This option is available when the Dynamic Range option in the General page is selected. |
| X Min. | The X minimum of the associated data set. This property is available when the Dynamic Range option is not selected. | |
| X Max. | The X maximum of the data value of the associated data set. This property is available when the Dynamic Range option is not selected. | |
| Y Min. | The Y minimum of the associated data set. This property is available when the Dynamic Range option is not selected. | |
| Y Max. | The Y minimum of the associated data set. This property is available when the Dynamic Range option is not selected. | |
| Mark Size | Select a size for the data point mark. The selection is valid when the Show Mark option in the General page is selected. | |
| Line Style | Select a style for the connecting lines. The selection is valid when the Show Line option in the General page is selected. | |
| Color | Select a color for the connecting lines. | |
Need PM Designer itself?
V4 for current PK, PT, ITV and PM panels, V2 for older models. Free, sent by email.
Source.Section 8.5.5 of the PM Designer Software User Manual, Edition 2.0, © Cermate Technologies Inc. (www.cermate.com, service@cermate.com). Reproduced online, with the manual's own figures, by TSL Automation Solutions, authorised Cermate distributor, for users of Cermate HMI panels. PM Designer and PanelMaster are trademarks of Cermate Technologies Inc.
Text and figures are the manufacturer's and may describe features your panel or software version does not have. For a plain-language introduction read the PM Designer guide; for help with a specific panel contact TSL Automation.