
Section 8.5.4 · Chapter 8: Graphs and Charts
Scatter Chart - General Settings
This section describes how to define the general settings for a scatter chart. The following is an example of the General page of the Scatter Chart property sheet.
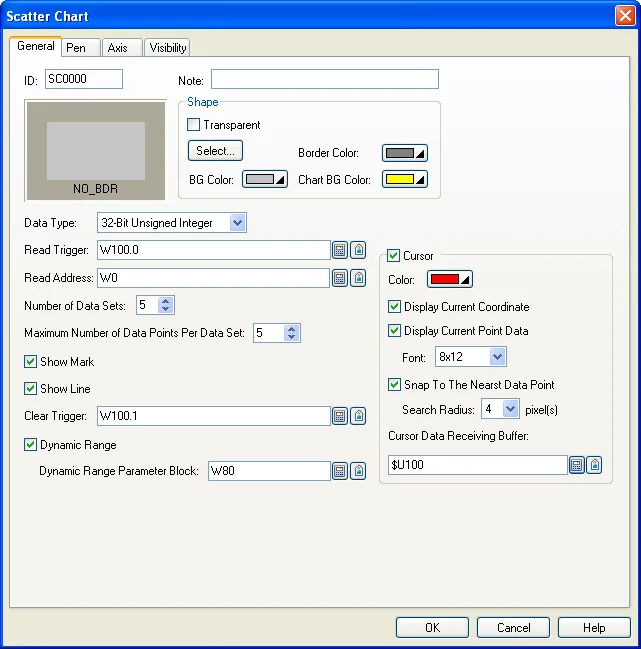
The following table describes each property in the General page.
|
Property |
Description | ||||
|---|---|---|---|---|---|
| ID | The object’s identifier. It is generated when the object is created. The identifier is unique within the screen where the object is located. The format of the IDs for the scatter charts is SCnnnn. | ||||
| Note | You can type a note for the object. | ||||
| Transparent | Select this option if you want the object to have a transparent background. | ||||
| Shape settings |
For details about the following properties, see
Section 4.3.4 Setting up the
Shape of an Object.
 ,
Border Color, BG Color |
||||
| Chart BG Color | Select a color for the background of the char. | ||||
| Data Type | The type of the data that the scatter chart will display. The supported data types include: 16-Bit Unsigned Integer, 32-Bit Unsigned Integer, 16-Bit Signed Integer, 32-Bit Signed Integer, 16-Bit BCD, 32-Bit BCD, 32-Bit Floating Point, 16-Bit Signed BCD (LMB), 32-Bit Signed BCD (LMB), 16-Bit Signed BCD (LMD), and 32-Bit Signed BCD (LMD). | ||||
| Read Trigger |
The bit variable or the word's bit variable that will trigger the scatter chart to
read and display data. The bit variable triggers the
scatter chart when its state changes from off to on.
Click
 to enter an address for this field. Click  to select a tag for this field. |
||||
| Read Address |
The variable whose data is to be read and displayed.
Click
to enter an address for this field. Click
to select a tag for this field. The following tables show the data arrangements of the variable. Data Type: 16-bit; Number of Data Sets: 1 |
||||
| Word | Description | ||||
| 0 | Actual number of data points | ||||
| 1 | X value of data point 0 | ||||
| 2 | Y value of data point 0 | ||||
| 3 | X value of data point 1 | ||||
| 4 | Y value of data point 1 | ||||
| … | … | ||||
| 2n+1 | X value of data point n | ||||
| 2n+2 | Y value of data point n | ||||
| Data Type: 16-bit; Number of Data Sets: 2 | |||||
| Word | Description | ||||
| 0 | Actual number of data points | ||||
| 1 | X value of data point 0; Data set 1 | ||||
| 2 | Y value of data point 0; Data set 1 | ||||
| 3 | X value of data point 0; Data set 2 | ||||
| 4 | Y value of data point 0; Data set 2 | ||||
| 5 | X value of data point 1; Data set 1 | ||||
| 6 | Y value of data point 1; Data set 1 | ||||
| 7 | X value of data point 1; Data set 2 | ||||
| 8 | Y value of data point 1; Data set 2 | ||||
| … | … | ||||
| 4n+3 | X value of data point n; Data set 2 | ||||
| 4n+4 | Y value of data point n; Data set 2 | ||||
| Data Type: 16-bit; Number of Data Sets: 8 | |||||
| Word | Description | Word | Description | ||
| 0 | Actual number of data points | 11 | X value of data point 0; Data set 6 | ||
| 1 | X value of data point 0; Data set 1 | 12 | Y value of data point 0; Data set 6 | ||
| 2 | Y value of data point 0; Data set 1 | 13 | X value of data point 0; Data set 7 | ||
| 3 | X value of data point 0; Data set 2 | 14 | Y value of data point 0; Data set 7 | ||
| 4 | Y value of data point 0; Data set 2 | 15 | X value of data point 0; Data set 8 | ||
| 5 | X value of data point 0; Data set 3 | 16 | Y value of data point 0; Data set 8 | ||
| 6 | Y value of data point 0; Data set 3 | 17 | X value of data point 1; Data set 1 | ||
| 7 | X value of data point 0; Data set 4 | 18 | Y value of data point 1; Data set 1 | ||
| 8 | Y value of data point 0; Data set 4 | … | … | ||
| 9 | X value of data point 0; Data set 5 | 16n+15 | X value of data point n; Data set 8 | ||
| 10 | Y value of data point 0; Data set 5 | 16n+16 | Y value of data point n; Data set 8 | ||
| Data Type: 32-bit; Number of Data Sets: 1 | |||||
| Word | Description | Word | Description | ||
| 0,1 | Actual number of data points | 8,9 | Y value of data point 1 | ||
| 2,3 | X value of data point 0 | … | … | ||
| 4,5 | Y value of data point 0 | 4n+2, 4n+3 | X value of data point n | ||
| 6,7 | X value of data point 1 | 4n+4, 4n+5 | Y value of data point n | ||
| Data Type: 32-bit; Number of Data Sets: 2 | |||||
| Word | Description | Word | Description | ||
| 0,1 | Actual number of data points | 12,13 | Y value of data point 1; Data set 1 | ||
| 2,3 | X value of data point 0; Data set 1 | 14,15 | X value of data point 1; Data set 2 | ||
| 4,5 | Y value of data point 0; Data set 1 | 16,17 | Y value of data point 1; Data set 2 | ||
| 6,7 | X value of data point 0; Data set 2 | … | … | ||
| 8,9 | Y value of data point 0; Data set 2 | 8n+6, 8n+7 | X value of data point n; Data set 2 | ||
| 10,11 | X value of data point 1; Data set 1 | 8n+8, 8n+9 | Y value of data point n; Data set 2 | ||
| Data Type: 32-bit; Number of Data Sets: 8 | |||||
| Word | Description | Word | Description | ||
| 0,1 | Actual number of data points | 22,23 | X value of data point 0; Data set 6 | ||
| 2,3 | X value of data point 0; Data set 1 | 24,25 | Y value of data point 0; Data set 6 | ||
| 4,5 | Y value of data point 0; Data set 1 | 26,27 | X value of data point 0; Data set 7 | ||
| 6,7 | X value of data point 0; Data set 2 | 28,29 | Y value of data point 0; Data set 7 | ||
| 8,9 | Y value of data point 0; Data set 2 | 30,31 | X value of data point 0; Data set 8 | ||
| 10,11 | X value of data point 0; Data set 3 | 32,33 | Y value of data point 0; Data set 8 | ||
| 12,13 | Y value of data point 0; Data set 3 | 34,35 | X value of data point 1; Data set 1 | ||
| 14,15 | X value of data point 0; Data set 4 | 36,37 | Y value of data point 1; Data set 1 | ||
| 16,17 | Y value of data point 0; Data set 4 | … | … | ||
| 18,19 | X value of data point 0; Data set 5 | 32n+30, 32n+31 | X value of data point n; Data set 8 | ||
| 20,21 | Y value of data point 0; Data set 5 | 32n+32, 32n+33 | Y value of data point n; Data set 8 | ||
| Number of Data Sets | Specifies how many data sets the scatter chart will display. A scatter chart can display up to 8 sets of data. | ||||
| Maximum Number of Data Points Per Data Set |
Specifies the maximum number of data points that the
scatter chart will display for every data set. A scatter
chart can display up to 999 data points for one data
set. Note: The actual number of data points for every data set is specified at runtime. The actual number must not exceed the maximum number. |
||||
| Show Mark | Check this option so the scatter chart will show a square mark on every data point. | ||||
| Show Line | Check this option so the scatter chart will display a line between two adjacent data points of a data set. | ||||
| Clear Trigger |
The bit variable or the word's bit variable that triggers the scatter chart to
clear its content when its state changes from off to on.
Click
to enter an address for this field. Click
to select a tag for this field. |
||||
| Dynamic Range | Dynamic Range | Check this option so the minimum and the maximum for the X and Y values of each data set can be specified at runtime. When this option is selected, the minimum and maximum of the marks for the X axis and Y axis can be specified at runtime as well. The data that specifies the above two ranges should be set and arranged correctly in a memory block called the dynamic range parameter block. You need to specify the dynamic range parameter block in the Dynamic Range Parameter Block field. | |||
| Dynamic Range Parameter Block |
Specifies the variable that stores the dynamic range
parameter block for the line chart when Dynamic Range is
selected. Click
to enter an address for this field. Click
to select a tag for this field.The following table shows the data arrangement of the parameter block when the data type is 16-bit. |
||||
| Word | Description | ||||
| 0,1 | The minimum of the mark for the X axis; 32-bit integer number | ||||
| 2,3 | The maximum of the mark for the X axis; 32-bit integer number | ||||
| 4,5 | The minimum of the mark for the Y axis; 32-bit integer number | ||||
| 6,7 | The maximum of the mark for the Y axis; 32-bit integer number | ||||
| 8 | The minimum of X values for pen #1; 16-bit integer number or 16-bit unsigned integer number | ||||
| 9 | The maximum of X values for pen #1; (Same as above) | ||||
| 10 | The minimum of Y values for pen #1; (Same as above) | ||||
| 11 | The maximum of Y values for pen #1; (Same as above) | ||||
| 12 | The minimum of X values for pen #2; (Same as above) | ||||
| 13 | The maximum of X values for pen #2; (Same as above) | ||||
| … | … | ||||
| 38 | The minimum of Y values for pen #8; (Same as above) | ||||
| 39 | The maximum of Y values for pen #8; (Same as above) | ||||
| The following table shows the data arrangement of the parameter block when the data type is 32-bit. | |||||
| Word | Description | ||||
| 0,1 | The minimum of the mark for the X axis; 32-bit integer number | ||||
| 2,3 | The maximum of the mark for the X axis; 32-bit integer number | ||||
| 4,5 | The minimum of the mark for the Y axis; 32-bit integer number | ||||
| 6,7 | The maximum of the mark for the Y axis; 32-bit integer number | ||||
| 8,9 | The minimum of X values for pen #1; 32-bit integer number, 32-bit unsigned integer number, or 32-bit floating point number | ||||
| 10,11 | The maximum of X values for pen #1; (Same as above) | ||||
| 12,13 | The minimum of Y values for pen #1; (Same as above) | ||||
| 14,15 | The maximum of Y values for pen #1; (Same as above) | ||||
| … | … | ||||
| 64,65 | The minimum of X values for pen #8; (Same as above) | ||||
| 66,67 | The maximum of X values for pen #8; (Same as above) | ||||
| 68,69 | The minimum of Y values for pen #8; (Same as above) | ||||
| 70,71 | The maximum of Y values for pen #8; (Same as above) | ||||
| Cursor | Show Cursor | Check this option so the scatter chart will display a cursor. You can touch and drag the cursor within the chart. | |||
| Color | Select a color for the cursor. | ||||
| Display Current Coordinate | Check this option to display the X and Y coordinate of the current cursor position. | ||||
| Display Current Point Data | Check this option to display the X and Y value of the current selected data. | ||||
| Font | Select a font for displaying the values of the selected data point. | ||||
| Snap To The Nearest Data Point | Check this option to find the closest point to the current cursor position within the search circle as the selected point. | ||||
| Search Radius | Specifies the radius of the search circle. The center of the search circle is at the current cursor position. | ||||
| Cursor Data Receiving Buffer |
The variable that will receive the value of the
selected data point. It must be a piece of the
internal memory. Click
to enter an address for this field. Click
to select a tag for this field.The following table shows the data arrangement of the buffer when the data type is 16-bit. |
||||
| Word | Description | ||||
| 0,1 | X coordinate of the current cursor position. | ||||
| 2,3 | Y coordinate of the current cursor position. | ||||
| 4 | The data set number of the current selected data. | ||||
| 5 | The sequence number of the current selected data. | ||||
| 6 | X value of current selected data. | ||||
| 7 | Y value of current selected data. | ||||
| The following table shows the data arrangement of the buffer when the data type is 32-bit. | |||||
| Word | Description | ||||
| 0,1 | X coordinate of the current cursor position. | ||||
| 2,3 | Y coordinate of the current cursor position. | ||||
| 4 | The data set number of the current selected data. | ||||
| 5 | The sequence number of the current selected data. | ||||
| 6,7 | X value of current selected data. | ||||
| 8,9 | Y value of current selected data. | ||||
Need PM Designer itself?
V4 for current PK, PT, ITV and PM panels, V2 for older models. Free, sent by email.
Source.Section 8.5.4 of the PM Designer Software User Manual, Edition 2.0, © Cermate Technologies Inc. (www.cermate.com, service@cermate.com). Reproduced online, with the manual's own figures, by TSL Automation Solutions, authorised Cermate distributor, for users of Cermate HMI panels. PM Designer and PanelMaster are trademarks of Cermate Technologies Inc.
Text and figures are the manufacturer's and may describe features your panel or software version does not have. For a plain-language introduction read the PM Designer guide; for help with a specific panel contact TSL Automation.