
Section 8.1.1 · Chapter 8: Graphs and Charts
Bar Graph - Basic Operations
A bar graph shows the value of a monitored variable by displaying a bar with
variable length. When the value of the variable increases or decreases, the
length of the bar increases or decreases accordingly. A bar graph can have a
scale and the scale enables you to measure the length of the bar and read the
current value of the monitored variable.
There are two bar types that a bar graph can have: a polar bar and a bipolar
bar. The polar bar can only move at one end, but the bipolar bar can move both
ends. The bar and the scale can be displayed in any of the following four
directions:
|
Type |
Upward | Downward | Leftward | Rightward |
|---|---|---|---|---|
|
Polar Bar (Monitored Value = 60) |
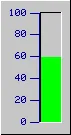 |
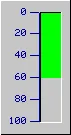 |
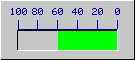 |
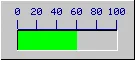 |
|
Bipolar Bar (Monitored Value = 60 Middle Point = 50) |
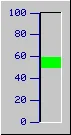 |
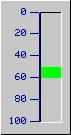 |
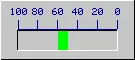 |
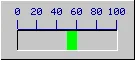 |
A bar graph can also have a scale, forward markers, backward markers and a percentage display.
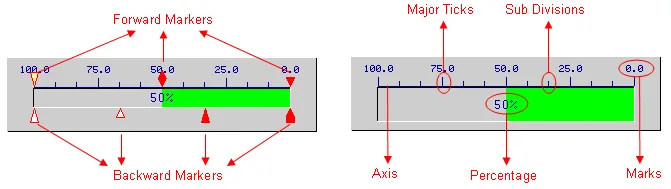
Note:
* If the bar graph is upward or downward, the scale and forward/backward markers
will be located on the left or right sides.
* If the bar graph is leftward or rightward, the scale and forward/backward
markers will be located at the top or bottom.
You can complete all the settings of a bar graph in the Bar Graph property sheet. This sheet contains the following six pages.
■ General
Described in Section 8.1.4.
■ Scale
Described in
Section 4.4.4.
■ F. Marker
Described in
Section
8.1.5.
■ B. Marker
Described in
Section
8.1.5.
■ Advanced
Described in
Section
8.1.6.
■ Visibility
Described in
Section
4.4.6.
Need PM Designer itself?
V4 for current PK, PT, ITV and PM panels, V2 for older models. Free, sent by email.
Source.Section 8.1.1 of the PM Designer Software User Manual, Edition 2.0, © Cermate Technologies Inc. (www.cermate.com, service@cermate.com). Reproduced online, with the manual's own figures, by TSL Automation Solutions, authorised Cermate distributor, for users of Cermate HMI panels. PM Designer and PanelMaster are trademarks of Cermate Technologies Inc.
Text and figures are the manufacturer's and may describe features your panel or software version does not have. For a plain-language introduction read the PM Designer guide; for help with a specific panel contact TSL Automation.